

If you’ve been overlooking your website’s load speed, let me tell you it’s high time to start giving it some thought.
Don’t stress, it’s not that tricky. There are free tools out there that make the job a lot easier.
And one of the best I know of is GTmetrix.
In this article, I’ll walk you through why you should be checking your site’s performance and how you can do it using this SEO tool we’re fortunate to have at no cost
Will you join me in this overview of GTmetrix’s features?

What is GTmetrix and why is it useful?
GTmetrix is an online tool that analyzes the load time of your website, gauging its performance and suggesting optimization improvements.
Why is measuring your site’s speed crucial for SEO?
Picture this: You sit down on a bar for a drink.
Minutes tick by, and no one takes your order.
You flag down a waiter, asking if they could serve you, and they assure you they’ll be right with you.
Yet, more time goes by, and you’re still waiting.
Eventually, you grow impatient and decide to leave for another bar.
The same scenario applies to your website. However, instead of minutes, we’re talking about mere seconds or even milliseconds.
If a user visits your site and it takes too long to load, they’ll likely bounce off to another site.
Google is well aware of this, which is why, nowadays, a site’s performance is a pivotal factor in its search ranking.
Tools like GTmetrix enable you to assess the factors impacting your website’s load times, empowering you to take the necessary steps to enhance the user experience.
How to Use GTmetrix
When it comes to using GTmetrix, you have three different modes to choose from, depending on how involved you want to be with the tool.
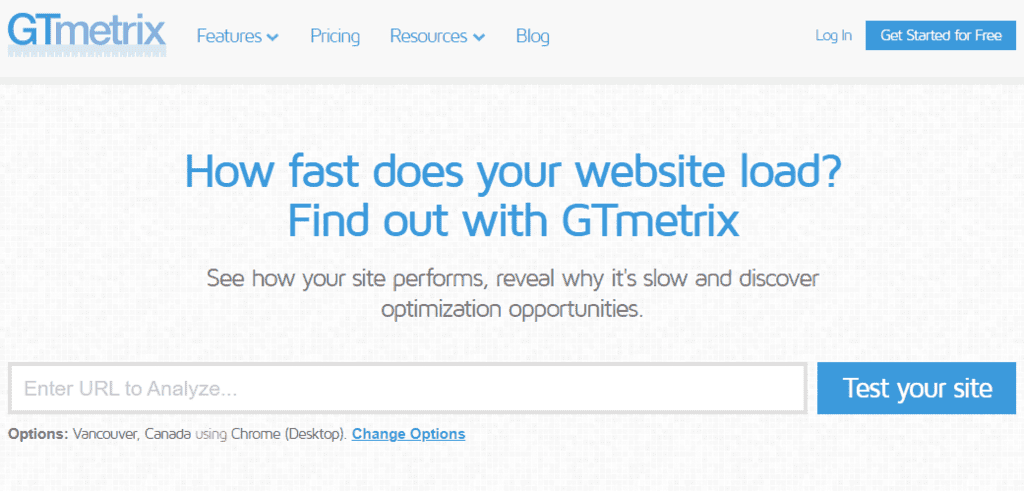
First off, there’s the most straightforward method, perfect if you just want to conduct a quick, occasional analysis of your site.
You don’t need to provide any personal information. Just enter your website’s URL on GTmetrix’s homepage, wait a few seconds, and you’re set to review the results.
If you’re aiming to keep a basic track of your website, I’d recommend setting up a free account.
You’ll need to provide an email address and, optionally, your name. In return, you’ll get a handful of benefits, such as:
- Certain test configuration options.
- Storage of recent reports.
- Monitoring of your main page.
- Alert settings.
- API access. Lastly, if you’re looking to use GTmetrix in a professional capacity, they offer a PRO version with several premium paid plans.
Let’s dive into the perks they provide.
Differences between GTmetrix’s Free Version and Paid Plans
Depending on your business needs, GTmetrix PRO offers a variety of paid plans to choose from.
From the most affordable option, priced at $13 a month, to a plan designed for larger businesses with more demanding usage.
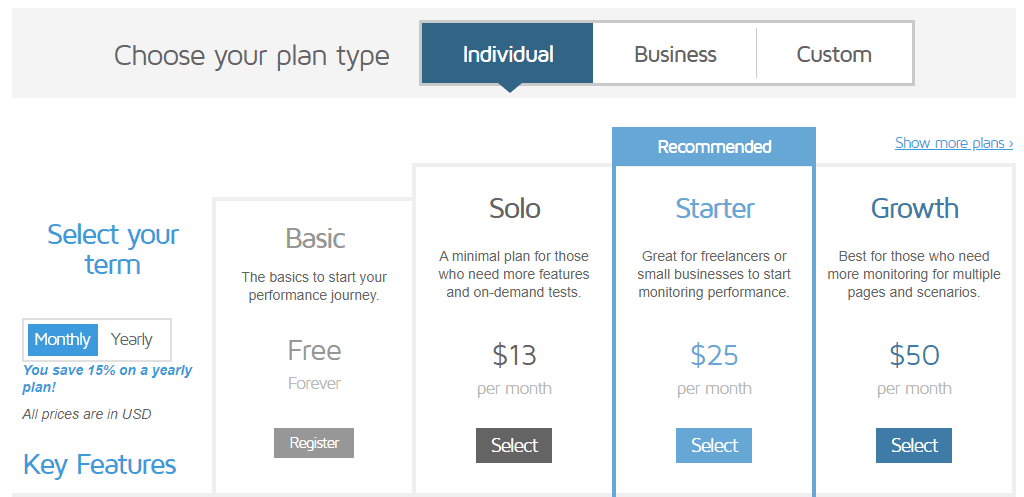
There’s even an option to customize a plan if none of the available packages suit your needs.
Regardless, the paid plans offer several benefits over the free version. Here are the ones I find most significant:
- Testing from servers located in a wider range of countries.
- Simulation of requests from mobile devices.
- A broader range of test configuration options.
- More comprehensive PDF reports.
- Monitoring of additional pages.
- Expanded API usage capabilities.
GTmetrix Step-by-Step Guide
Next, I’ll walk you through how to use GTmetrix’s main features.
You’ll see it’s not overly complex. It just requires a clear understanding of certain concepts.
By the end, you’ll be able to perform a performance analysis of your websites with ease.
Main Dashboard
For this guide, I’ve used the free version of GTmetrix, as it’s more than adequate for conducting an analysis and basic tracking of our website.
After logging in with our username and password, the tool takes us to a control panel made up of three main areas.
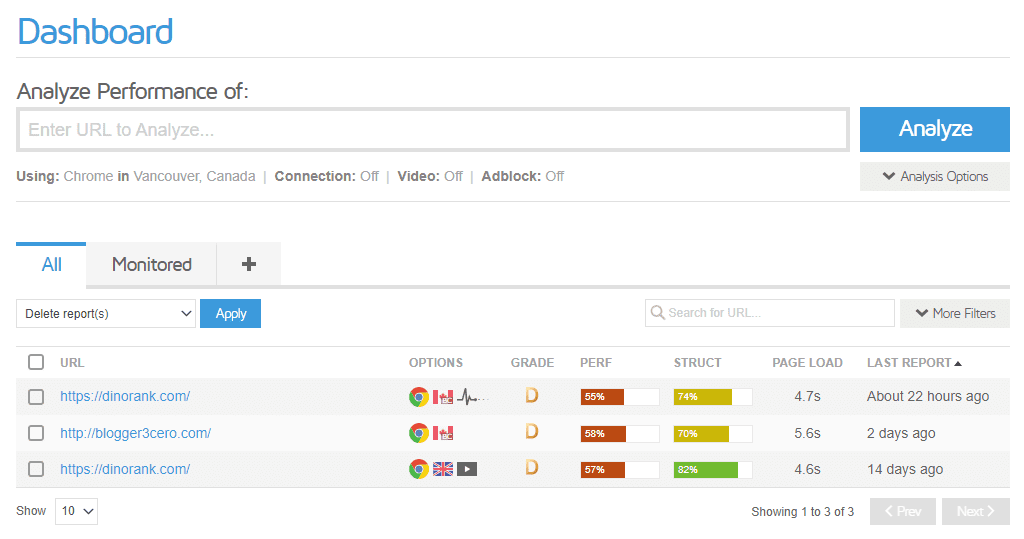
At the bottom, we have two tabs.
- The first provides access to the reports of the tests we’ve already run.
- The second displays the projects we are monitoring.
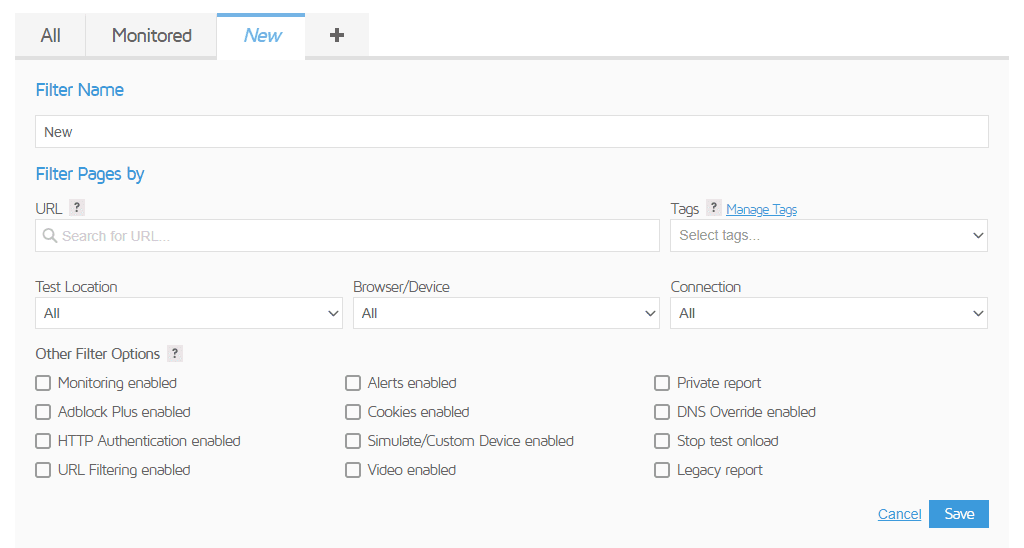
Furthermore, we can create new tabs based on the filters we set up.
In the upper part of the control panel, we see a text box where we should enter our page’s URL to conduct new tests.
Let’s now analyze the DinoRANK page.
But before we initiate the test, we’ll set up some options.
GTmetrix Analysis Options
Right below the “Analyze” button, there’s a dropdown menu to access the configuration settings.
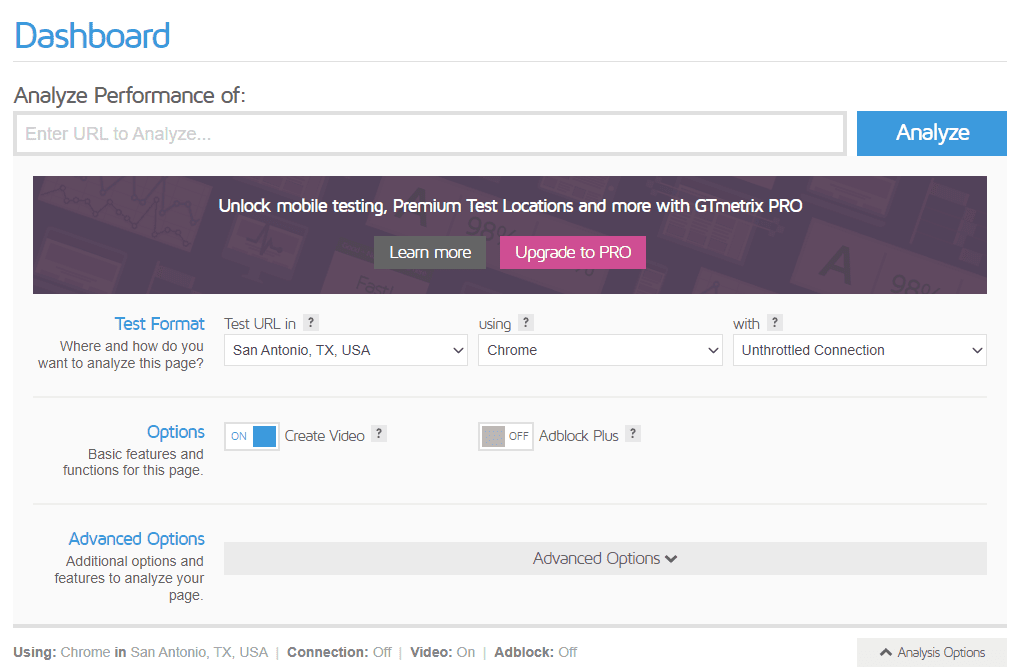
As you’ll notice, most of the options are only available for the PRO plans.
However, let’s look at what we can set up for our analysis:
- Location. The server location from which the tests will be launched. It’s useful to configure if you want your website to target a specific country. We’ll choose San Antonio to see how the website performs for the USA.
- Device. In this case, we can only select the speed test to be done for desktop (using the Google Chrome web browser).
- Connection. In case we want to analyze a specific type of connection. We’ll leave it as the default value.
- Video. A video will be created showing our website’s loading sequence. We’ll enable this.
- Adblock Plus. To prevent third-party ads from loading. For our purposes, we’ll keep this disabled.
Besides these configuration options, GTmetrix also provides other advanced settings.
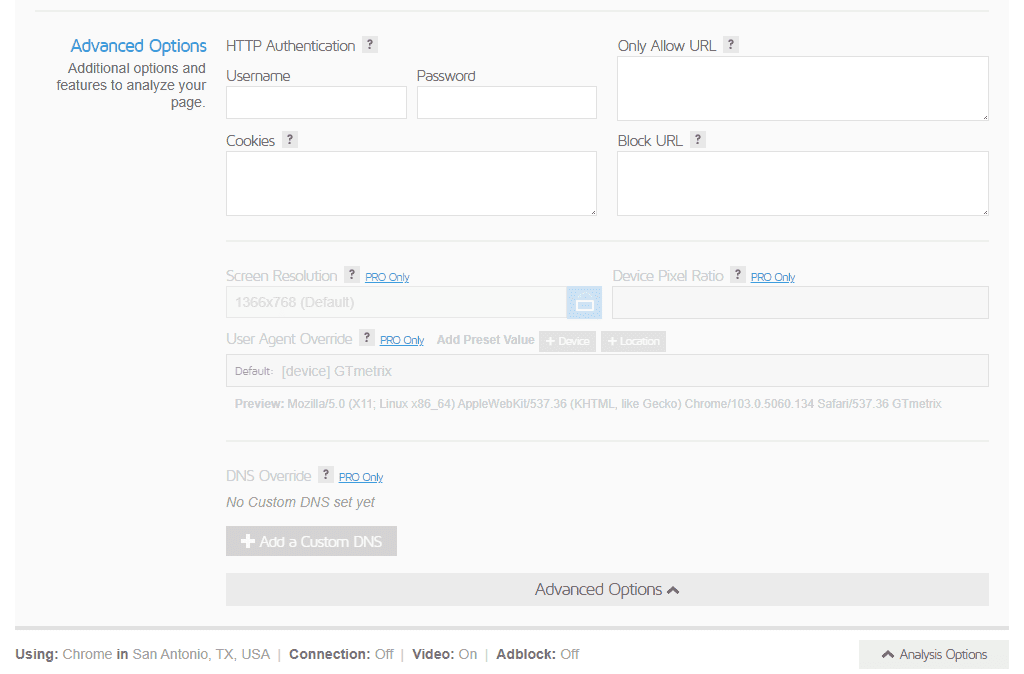
In this way, if needed, you can set up authentication to access your website, manage cookie storage, or block URLs with resources you don’t want to load.
There are also more configuration parameters available for the PRO version.
Typically, these additional options aren’t usually required. However, if at some point you want to use them, it’s good to know where to find them.
Analyzing a website and interpreting the results
Once we’ve set up our analysis, it’s time to click the blue “Analyze” button to run it.
Upon completion, GTmetrix displays a page with the results.
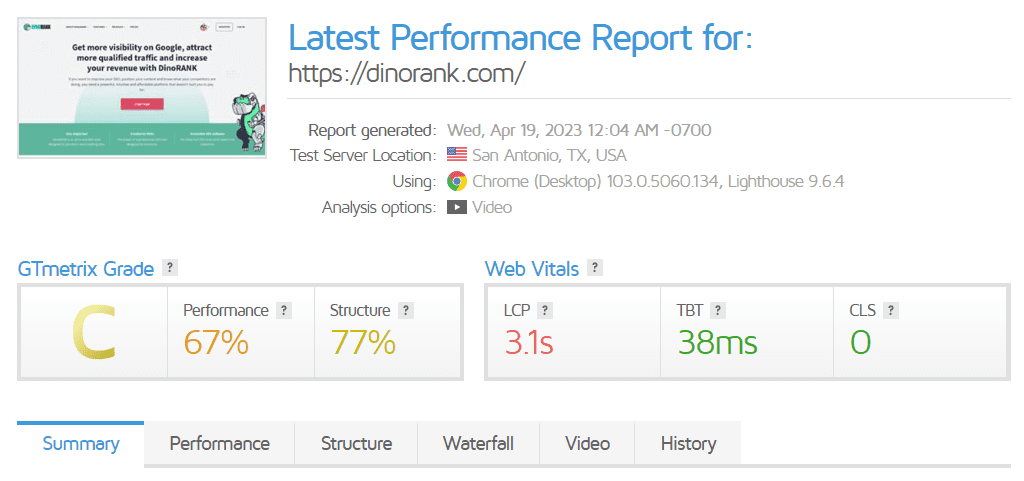
At the top, we can see a screenshot of our website, along with a summary of the test configuration.
Next, we receive the overall score that GTmetrix assigns to our website.
This overall score is represented by a letter (from A to F) and is calculated as an average of the following two metrics (in a 70/30 proportion):
- Performance Score. It indicates the performance of our website, based on the parameters measured by Google’s Lighthouse tool.
- Structure Score. It gives us an idea of how our website is constructed in terms of implementing best practices for achieving good performance.
Alongside the GTmetrix scores, we also get a view of the main metrics from Google’s Web Vitals.
Lastly, at the bottom, there are a series of tabs through which we can access more detailed information that we will explain next.
Summary Tab
The summary tab gives us an overall view of the page’s performance.
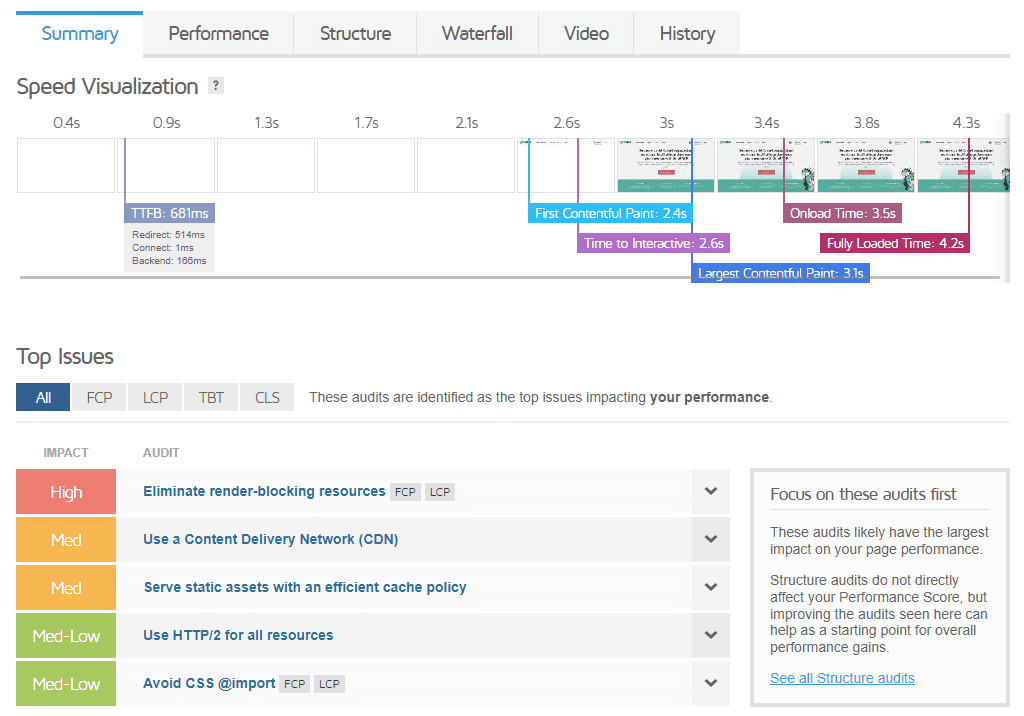
The most intriguing part, in my opinion, is at the beginning and it’s a graphical representation of the website’s load time.
We can see how the page’s content is displayed over time, as well as the moments when the main metrics used in the analysis take place.
Following this, we have GTmetrix’s recommendations to improve the website’s loading times.
This list is merely a quick view of what we’ll find in the Structure tab.
Lastly, the Summary tab displays a graphical representation of our page’s resource distribution from two perspectives: the size they represent and the number of requests made for each resource type.
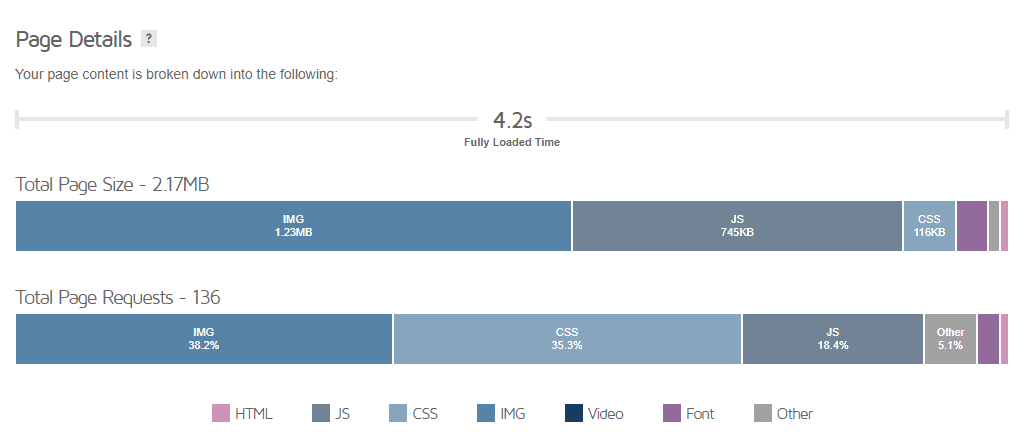
In this way, we can get an idea of the impact these resources have on the page load.
Performance Tab
In this tab, we find the details of each metric.
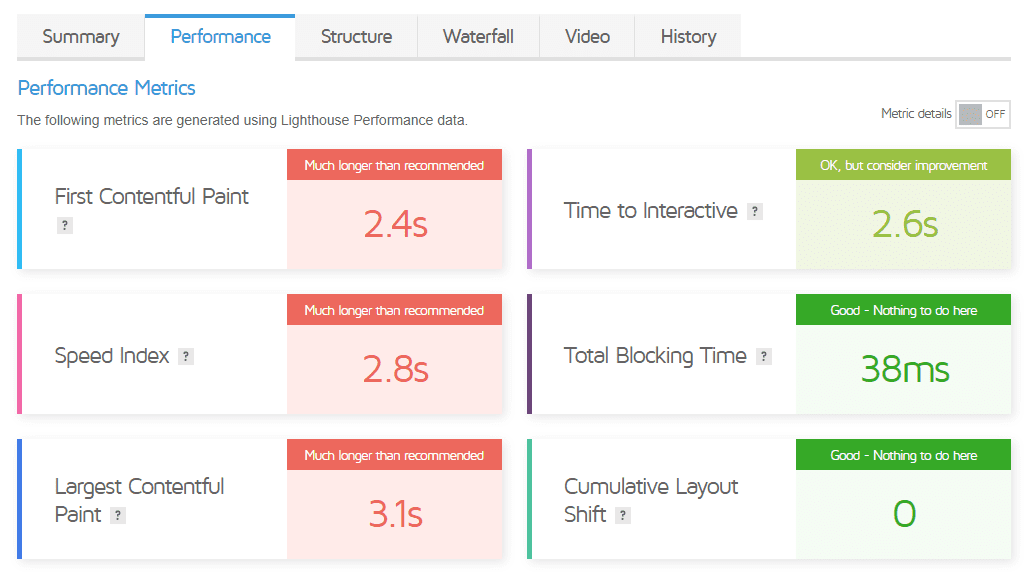
Firstly, we see measurements from Google’s Lighthouse tool, applied to the parameters for which we’ve configured our speed test in GTmetrix (location, device, connection, etc).
These metrics are:
- First Contentful Paint (FCP). Time taken to display the first complete image or text on the website.
- Speed Index. Time at which the page elements become visible.
- Largest Contentful Paint (LCP). Time taken to paint the largest element on the website.
- Time to Interactive. How long it takes for all elements to load to allow full interaction with the page.
- Total Blocking Time (TBT). Time, post FCP, when the page is blocked due to script execution and doesn’t allow any interaction.
- Cumulative Layout Shift (CLS). Indicates if there are elements that change position during page load. The assessment of these 6 metrics determines the page’s Performance Score, which we’ve already discussed earlier.
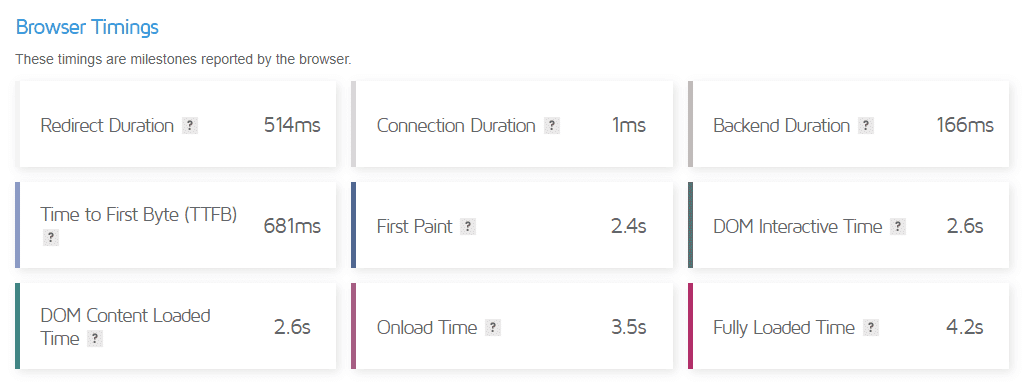
On the other hand, this tab displays other metrics which, while not directly influencing the Performance Score, do provide information about the web performance
If you want to understand what each of these metrics means, simply click on the question mark icon next to them.
| GTmetrix vs. Google Pagespeed |
| Insights Even though both tools are based on Google’s Lighthouse software, the metrics they display can slightly differ. This is due to the different configuration settings for the tests, which can yield varying measurements based on their specifics. Factors like server locations, the hardware used, or the connections of the networks utilized by each tool can somewhat affect the outcomes. Regardless, these differences shouldn’t be substantial, and either of the two applications is valid for assessing a website’s performance. |
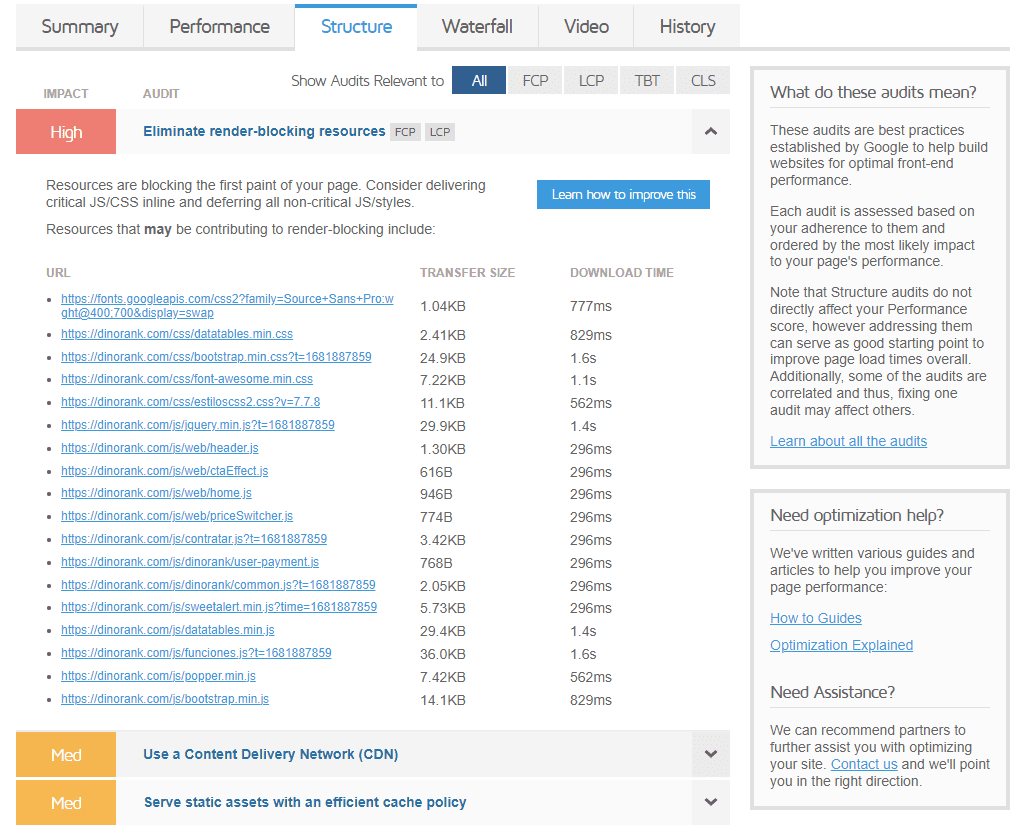
Structure Tab (structure)
This section is likely the most practical part of the report, as it points out the actions we can take to enhance our website’s performance.
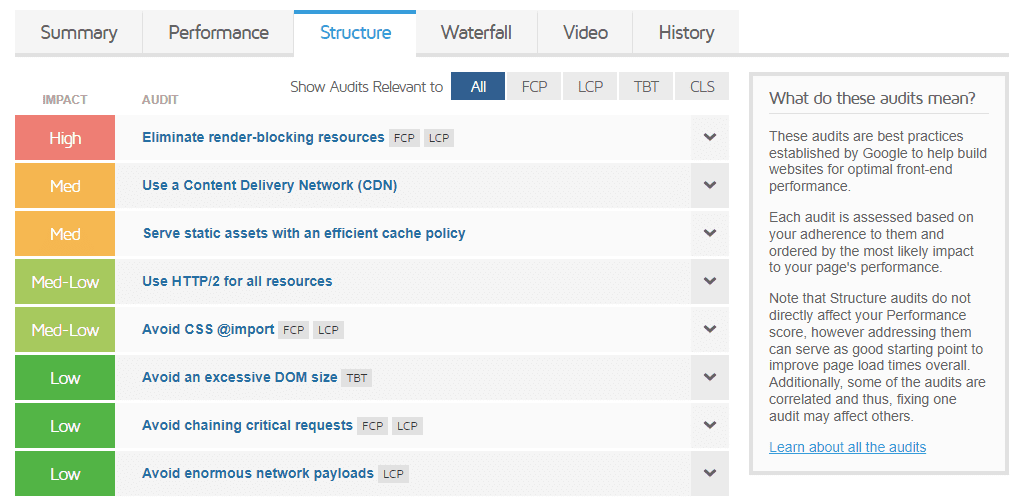
Each recommendation is color-coded based on the impact it would have on your website if implemented.
They are also tagged with the metrics that could be improved by executing them, allowing you to filter the results based on these tags.
By expanding the details of each action, you can view a brief description of it, the resources that would be affected, and a link to more information on how to implement the improvement.
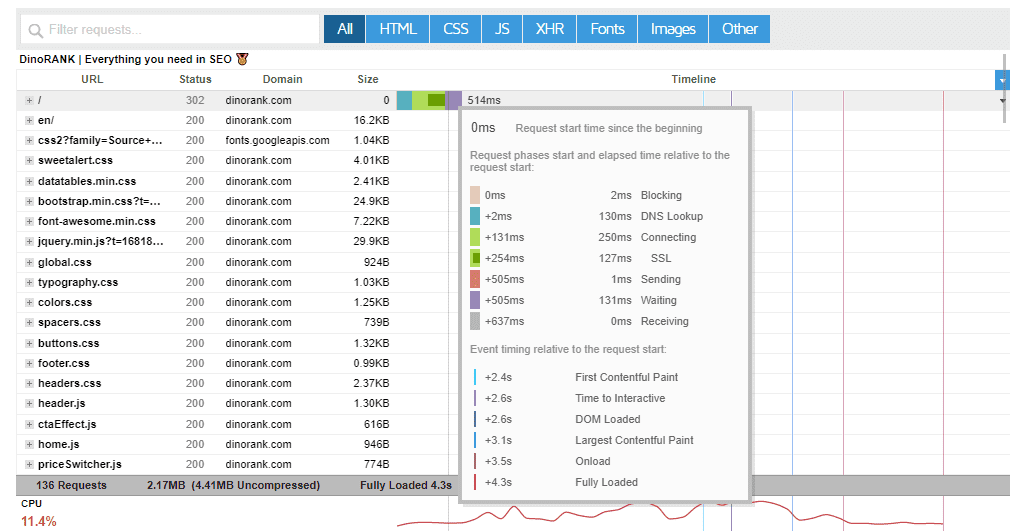
‘Waterfall’ tab
In the ‘Waterfall’ tab, we get a graphical and detailed view of the requests made to fully load a web page.
In this way, we can see, in chronological order, all the resources that are requested to display all the elements of the page.
We have several columns (URL, response code, resource size, etc.), but the most interesting one is undoubtedly called ‘Timeline’.
This displays the time it takes for a specific resource to load using a color scale that indicates the different sequences of the load:
- Brown. Time it remains blocked.
- Teal. DNS resolution.
- Green. Connection to the server.
- Red. Sending the request to the server.
- Purple. Waiting for the response.
- Gray. Receiving the resource.
Hovering over the resource, we can see more details about these requests, as well as other related metrics.
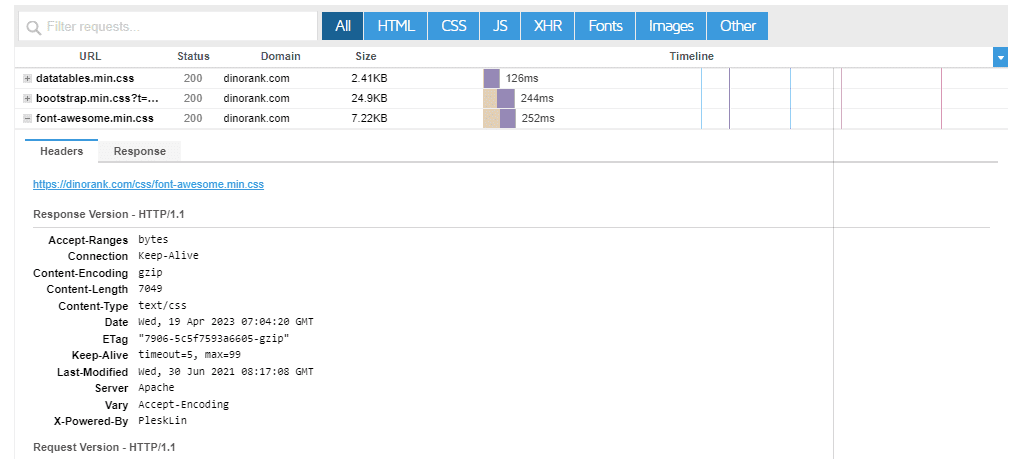
Lastly, if we click on each row of the table, we will access the details of the resource request and the response.
Tab Video (video representation)
Do you remember the configuration option that allowed us to create a video of the loading sequence? In this tab, you can see the result.
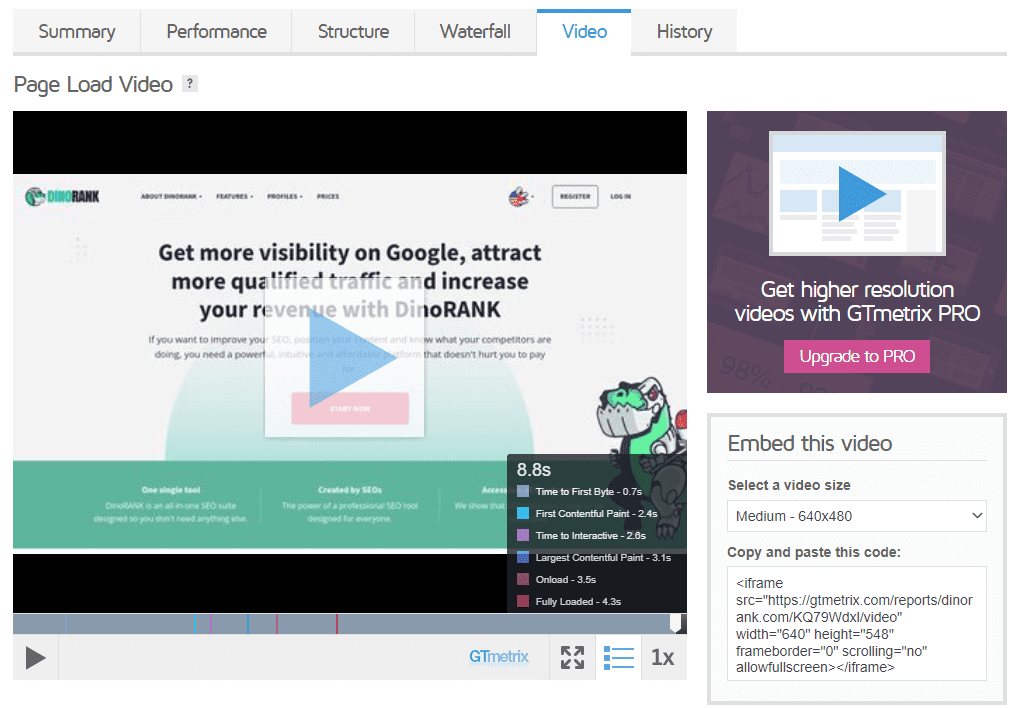
Thus, you can easily see how the elements of your website are loaded.
Additionally, to make the task easier for you, there are time stamps on the video indicating the key moments of each metric, and you have the option to play it back at a reduced speed.
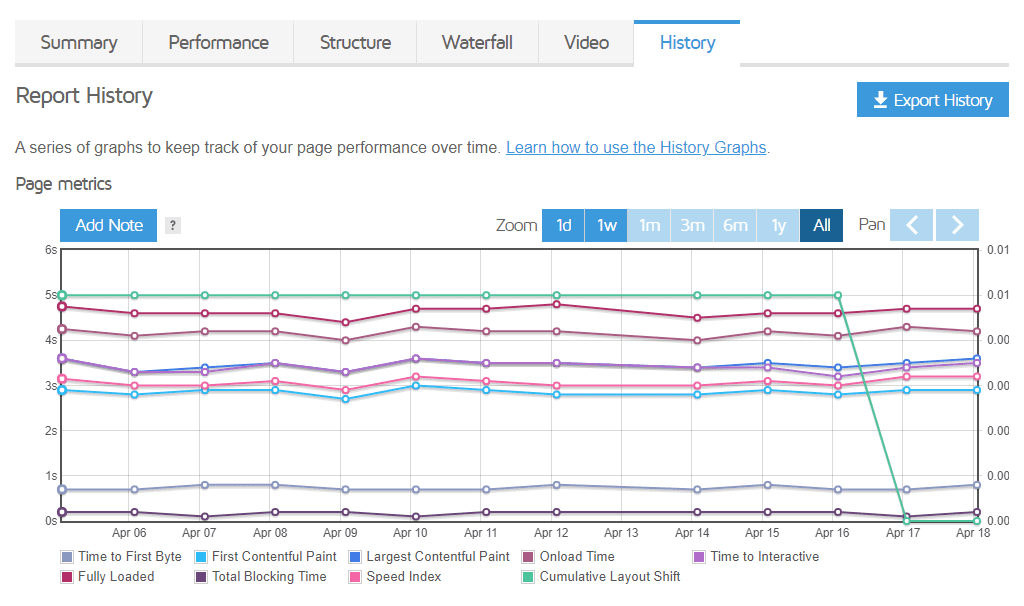
Tab History (history)
The last tab provides access to the history of your requests.
If you’ve run the same test multiple times, from this section you can track the progress through various charts.
Comparison of Reports
GTmetrix offers you the ability to compare reports with each other.
In this way, you can observe variations in a website’s performance under different configurations (locations, devices, connections, etc).
You could also compare two different pages, for example, to study the differences with your competitors.
Thus, the report comparison screen displays all the analyses, one after the other.
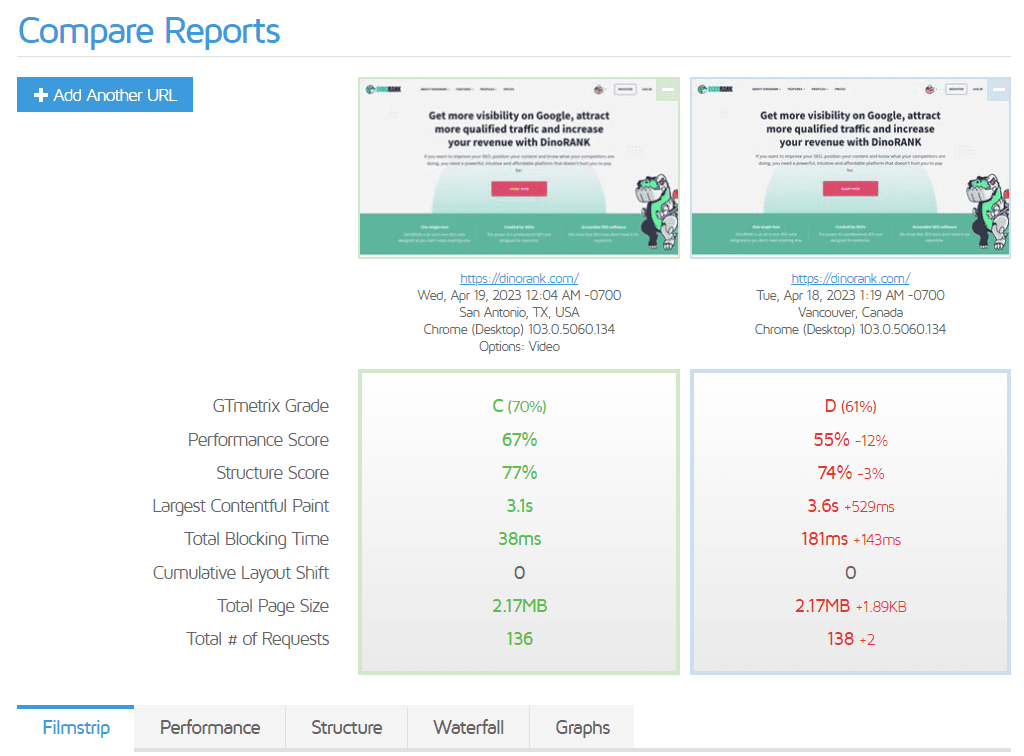
In the upper part, we observe their main metrics. At a quick glance, we can see the most important differential aspects.
Below, we have more extended information, grouped into several tabs through which we can compare:
- The loading sequences.
- The performance metrics.
- Optimizations in the structure.
- The succession of requests.
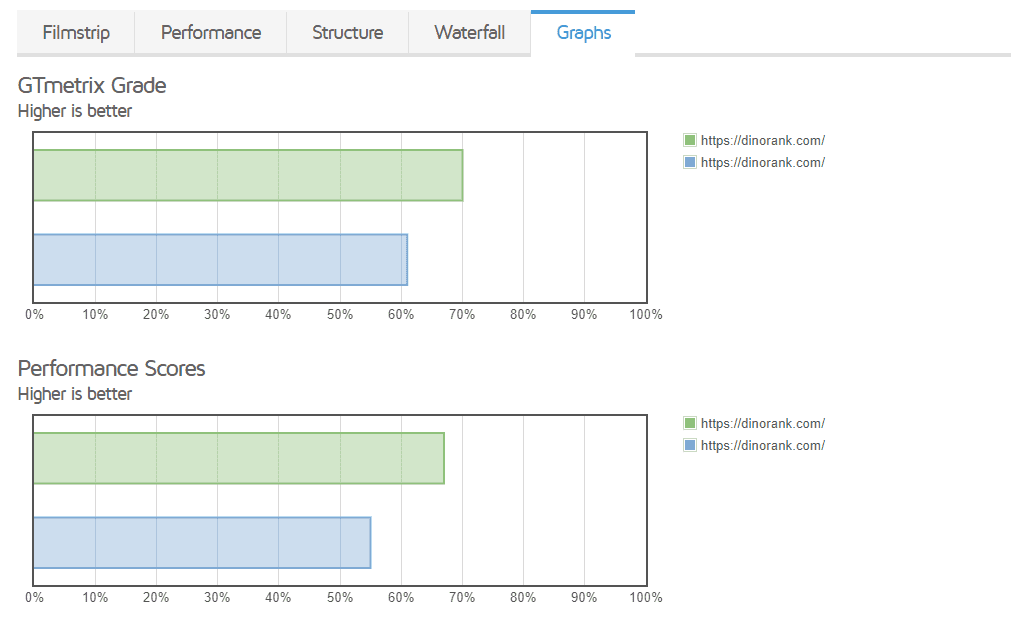
Finally, in the last tab, we have different charts that contrast the most outstanding metrics.
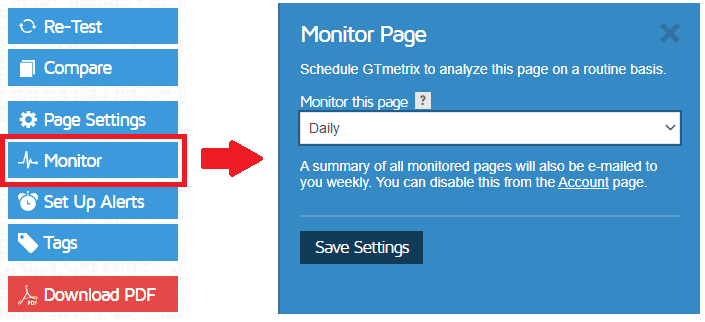
Monitoring and alerts
One of the utilities of GTmetrix is the ability to monitor certain web pages.
However, in the free version, this functionality is restricted to a single report and only for those tests you have set up with the default web server (Vancouver, Canada).
Therefore, if you want more flexibility, you’ll have to pay.
To track a report, you just have to indicate it through the ‘Monitor’ button that appears on the right side of the page and specify the tracking frequency.
In addition, you can set alerts.
Again, the option is located in the buttons on the right side of the page.
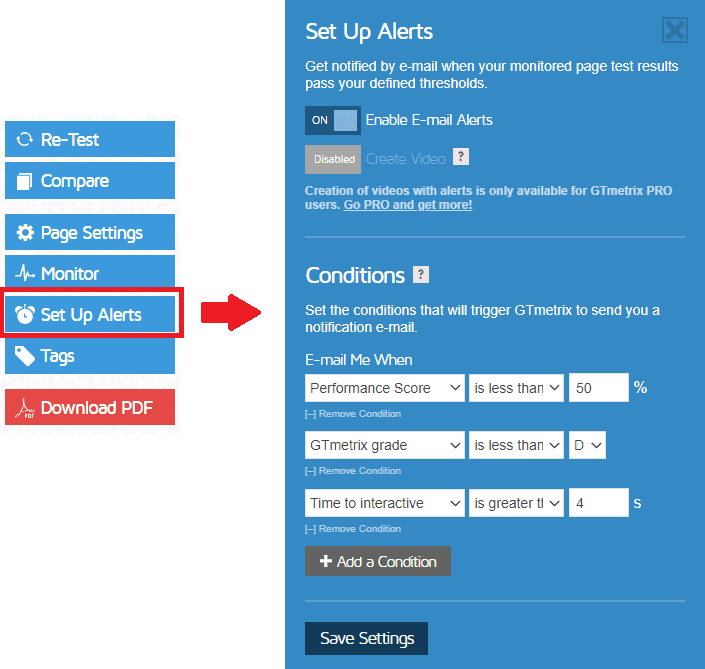
You just have to define different conditions that the metrics you want to monitor must meet, so that GTmetrix sends you an email if they are met at any time.
GTmetrix API
GTmetrix has an API to integrate its measurements into other applications.
This API operates based on credits. In the free version, they are practically symbolic and increase according to the payment plan you subscribe to.
However, if you use GTmetrix occasionally, the limitations of its free version might be more than enough for you.
Among the existing applications that use the API, it is worth highlighting a WordPress plugin that allows you to consult GTmetrix metrics directly from the CMS itself.
Conclusion and Opinions
GTmetrix is a very useful tool for improving the performance of a web page.
It not only provides you with metrics to assess the loading speed and behavior of the page but also guides you on how to optimize it.
And the best part is that you can use the tool for free.
If you don’t want to, there’s no need even to sign up.
However, if you have a website and want to improve it, I would recommend opening an account.
You have nothing to lose and will have access to many more options, which I’m sure will help you enhance your website’s performance.
